Measured35
Figures from a study, trial or official dataset, stated at the scale they were measured.
The share of US database foods meeting a fixed hyper-palatability definition rose from 49% in 1988 to 62% in 2001 and 69% in 2018.
Scale US food composition databases
M01 · United States · 1988 to 2018 · Share of database food items · E01 · checked 2026-10-18
61.37% of 5,340 Canadian packaged products met the hyper-palatability definition in 2023, against 63.03% of US products. In Health Canada's nutrient file, 55% of the 3,442 foods listed in both the 2001 and 2026 editions carry identical energy, fat, carbohydrate and sodium values.
Scale Packaged products; national reference file
M02 · Canada · 2001 to 2026 · Share of products; unchanged database values · K03 K11 K06 · checked 2026-10-18
Ultra-processed food supplied 45.7% of Canadians' daily energy in 2015, and more than half for children and adolescents.
Scale National dietary survey
M03 · Canada · 2004 and 2015 · Share of daily energy, NOVA · H09 · checked 2026-10-18
29.6% of eligible grocery items tracked in Canada's Consumer Price Index shrank between 2021 and 2023; 77.6% of the size cuts were on name brands.
Scale Eligible packaged groceries
M04 · Canada · 2021 to 2023 · Share of CPI grocery items · C13 · checked 2026-10-18
Of 6,628 Canadian packaged products matched between 2013 and 2017, 12.4% lowered their sugar and 11.0% raised it.
Scale National packaged supply
M05 · Canada · 2013 to 2017 · Matched product sugar content · R18 · checked 2026-10-18
Canada's voluntary sodium targets were met in 13 of 94 food categories; 48% made no meaningful progress.
Scale Processed food categories
M06 · Canada · 2012 to 2017 · Category averages vs targets · R09 · checked 2026-10-18
After the UK soft drinks levy was announced, drinks above 5 g of sugar per 100 mL fell from an expected 49% to 15%.
Scale UK soft drinks
M07 · United Kingdom · 2016 to 2019 · Share of drinks over threshold · R20 · checked 2026-10-18
Modern tomato varieties carry significantly less of 13 flavour compounds than heirlooms, and 47 of 48 carry low-sugar alleles at two key loci.
Scale 398 varieties
M08 · Varieties grown in Florida · Published 2017 · Flavour chemistry and genetics · P01 · checked 2026-10-18
Tomatoes with the working copy of the gene broken by uniform-ripening selection carry about 10% more soluble solids.
Scale Paired varieties
M09 · US research · Published 2012 · Soluble solids · P02 · checked 2026-10-18
In seven apple varieties stored up to eleven months, 1-MCP and very-low-oxygen storage each suppressed the recovery of aroma, and storage length had the largest effect.
Scale Commercial storage trials
M10 · Michigan · 2024 · Aroma volatiles · P03 P04 · checked 2026-10-18
In Broadbalk wheat, zinc, iron, copper and magnesium were stable from 1845 to the mid-1960s and then declined with semi-dwarf high-yield varieties, while soil levels held or rose.
Scale One long-term field
M11 · England · 1845 onward · Grain mineral concentration · E04 · checked 2026-10-18
Across 43 US garden crops, median values for six nutrients were lower in 1999 USDA tables than in 1950 tables, from 6% for protein to 38% for riboflavin.
Scale USDA composition tables
M12 · United States · 1950 vs 1999 · Median nutrient ratio · E03 · checked 2026-10-18
Offered meals matched for calories, energy density, macronutrients, sugar, sodium and fibre, adults ate about 508 more calories a day on an ultra-processed diet; a Japanese repeat found 813.5.
Scale Inpatient trials
M13 · United States, Japan · 2019, 2024 · Energy intake · H04 N36 · checked 2026-10-18
On two diets that both met the UK Eatwell Guide, adults lost 2.06% of body weight on the minimally processed diet and 1.05% on the ultra-processed diet over eight weeks.
Scale 55 adults, crossover
M14 · United Kingdom · Published 2025 · Weight change · E05 · checked 2026-10-18
Five months of lower sodium lowered adults' preferred salt level; three months of lower sugar made the same puddings taste about 40% sweeter with no change in liking.
Scale Controlled diet studies
M15 · United States · 1982, 2016 · Taste preference and intensity · C24 C25 · checked 2026-10-18
55% of 423 Canadian infant and toddler products would carry the "high in sugars" symbol.
Scale National product set
M16 · Canada · 2020 product data, published 2025 · Front-of-package criteria · N20 · checked 2026-10-18
Canada's salad oil supply rose from 2.62 kg to 17.22 kg per person between 1970 and 2025, while refined sugar fell from 44.97 kg to 27.13 kg.
Scale National supply
M17 · Canada · 1970 to 2025 · Food availability · L25 · checked 2026-10-18
Sugar-sweetened drinks raised C-reactive protein by 60% to 109% in three weeks; across 64 trials, sugar raised it when delivered in sweetened drinks.
Scale Controlled trials
M18 · Switzerland; international trials · 2011, 2022 · Inflammatory marker · N01 N03 · checked 2026-10-18
Cutting sugar lowered adults' body weight by 0.80 kg and adding it raised weight by 0.75 kg in trials of free-living people.
Scale Meta-analysis of trials
M19 · International · Published 2013 · Body weight · N07 · checked 2026-10-18
Each 10-point rise in the ultra-processed share of diet carries about 3% higher risk of premature death, attributing 4% to 14% of premature deaths across eight countries.
Scale National populations, modelled
M20 · Eight countries including Canada · Published 2025 · Attributable fraction · H02 · checked 2026-10-18
FAO prices the hidden costs of agrifood systems at 11.6 trillion 2020 PPP dollars a year, 70% of it from dietary patterns leading to chronic disease.
Scale Global, modelled
M21 · 156 countries · 2024 report · Hidden costs · H08 · checked 2026-10-18
Canadian adults eating the most ultra-processed food had 31% higher odds of obesity, 37% of diabetes and 60% of hypertension than those eating the least.
Scale National survey
M22 · Canada · Published 2021 · Odds ratios · H10 · checked 2026-10-18
No dietary or supplement intervention has been shown to treat long COVID across four trials of 794 patients; a healthy overall lifestyle before infection was linked to about half the risk of developing it.
Scale Patients and a nurses' cohort
M23 · International trials; United States cohort · 2023 to 2024 · Trials and cohort · N14 C17 · checked 2026-10-18
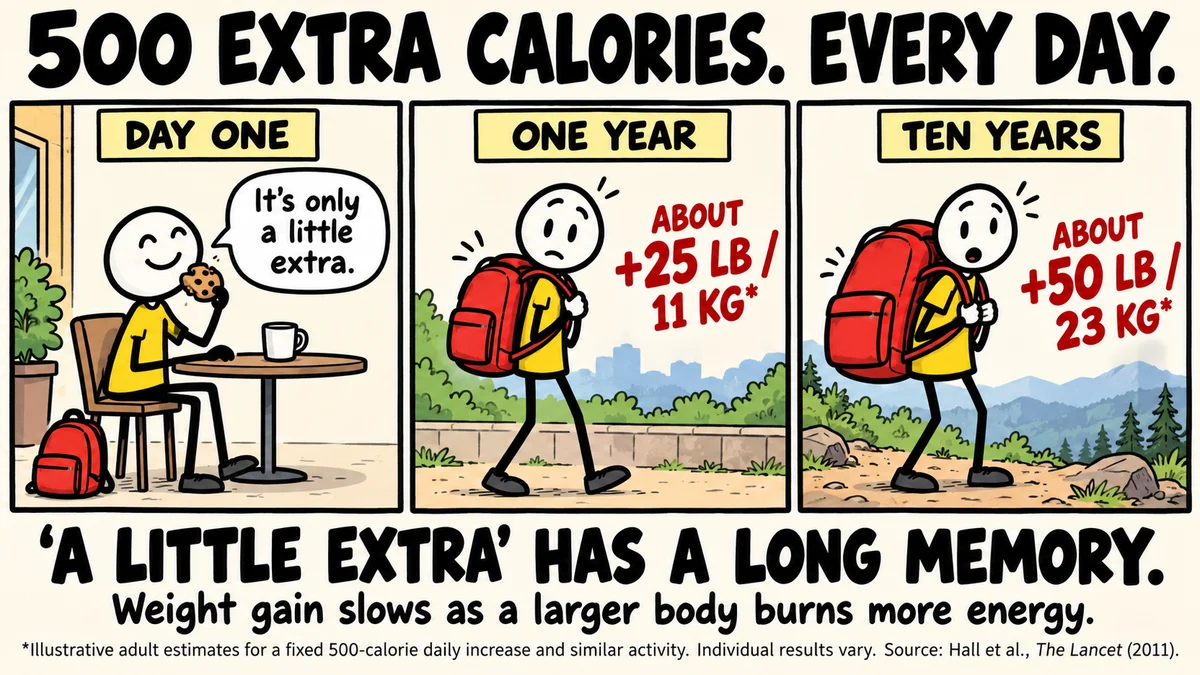
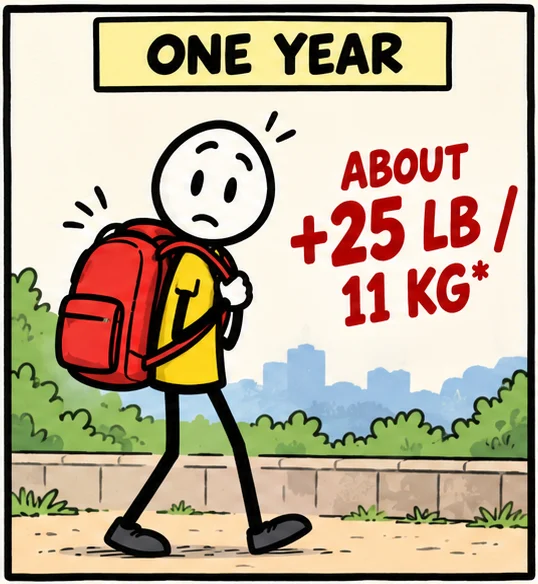
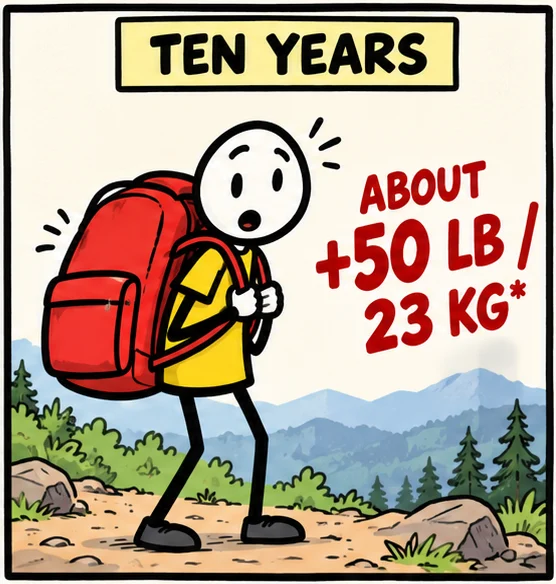
Each 10 extra calories a day adds about a pound of eventual adult body weight, half within a year and 95% within about three years; 500 extra calories a day comes to about 25 lb (11 kg) in the first year and about 50 lb (23 kg) at the plateau.
Scale Population-average adult
M24 · United States, adult model · Published 2011 · Modelled weight change · H13 · checked 2026-10-18
Produce carried a 38% gross margin on 14.8% of store sales across 15 US chains in 2023, against about 28% for independent grocers' whole stores.
Scale Chains
M25 · United States · 2023 to 2026 · Department gross margin · G01 G17 · checked 2026-10-18
Kroger booked $8.5 billion in vendor allowances in 2017 against $2.1 billion in operating profit.
Scale One retailer
M26 · United States · 2017 · Vendor allowances · G10 · checked 2026-10-18
Fruit and vegetables received 2.1% of measured food and drink advertising spending in Canada in 2019.
Scale National
M27 · Canada · 2019 · Advertising expenditure · W20 · checked 2026-10-18
Five varieties supply about 60% of the US apple crop, and yellow Cavendish bananas are 90.8% of US banana sales.
Scale National
M28 · United States · 2025 · Production and sales shares · V07 V23 · checked 2026-10-18
Sysco serves about 18% of a $377 billion US foodservice market; its own brand is 35.4% of its US broadline cases, and fresh produce is 8% of its sales.
Scale One distributor
M29 · United States · 2026 · Company filing · F01 · checked 2026-10-18
Four firms hold 72% to 95% of EU plant variety rights for tomato, lettuce, cucumber and carrot, and about half of global commercial seed sales.
Scale Sector
M30 · EU; global · 2018 to 2022 · Variety rights and seed sales · W17 W18 · checked 2026-10-18
Vegetables are 30% and fruit 15% of avoidable household food waste in Canada; fresh produce is the most wasted food category in UK homes.
Scale National
M31 · Canada, United Kingdom · 2017 to 2022 · Household waste composition · Z10 Z08 · checked 2026-10-18
About 12% of US adults meet the fruit recommendation and 10% the vegetable recommendation; in Canada the share eating fruit and vegetables five or more times a day fell from 31.5% in 2015 to 21.6% in 2023.
Scale Adults
M32 · United States, Canada · 2015 to 2023 · National surveys · Z16 Z17 · checked 2026-10-18
Doubling a portion raises intake by about 35%, and larger packages and portions raise intake across controlled trials.
Scale Trials
M33 · International · 2014, 2015 · Meta-analyses · Z21 Z22 · checked 2026-10-18
Moral licensing appears when people are observed and disappears in private once publication bias is corrected, across 115 experiments.
Scale 21,770 participants
M34 · International · Published 2025 · Pre-registered meta-analysis · Y12 · checked 2026-10-18
Moving fruit and vegetables to the entrance and removing sweets from checkouts raised produce sales by about 9,800 portions per store per week and lowered confectionery sales.
Scale Supermarkets
M35 · United Kingdom · Published 2021 · Store sales, non-randomised trial · Y15 · checked 2026-10-18
On the record13
Decisions, payments, ownership and rules, with their dates.
Coca-Cola replaced sugar with high-fructose corn syrup in its US bottling syrup from January 1980, reaching no sugar by November 1984.
Scale One product
D01 · United States · 1980 to 1984 · Court record · R01 R02 · checked 2026-10-18
German Nutella's recipe changed in 2017: milk powder up, sugar up, cocoa down by laboratory measure.
Scale One product
D02 · Germany · 2017 · Consumer agency analysis · R04 R05 · checked 2026-10-18
The US kiwifruit maturity floor was lowered from 6.5% to 6.2% soluble solids in 2000, partly to reduce reinspection costs.
Scale One crop
D03 · United States · 2000 · Federal rule · S03 · checked 2026-10-18
Washington raised its Red Delicious soluble solids minimum from 10% to 11% in 2002 "to market a sweeter more edible apple".
Scale One crop
D04 · Washington State · 2002 · State rule · S18 · checked 2026-10-18
The Sugar Research Foundation funded a 1967 NEJM review of diet and heart disease without disclosure, and defunded a 1970 study linking sucrose to raised blood fats.
Scale Two projects
D05 · United States, United Kingdom · 1965 to 1970 · Internal documents · C03 C04 · checked 2026-10-18
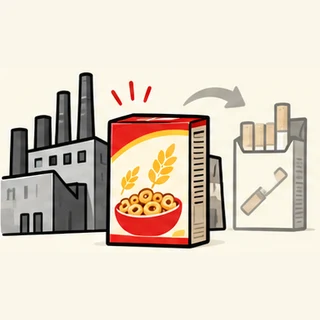
Philip Morris and R.J. Reynolds owned General Foods, Kraft, Nabisco, Kool-Aid, Tang, Capri Sun and Hawaiian Punch between 1963 and 2007.
Scale Company ownership
D06 · United States · 1963 to 2007 · Ownership records and filings · C02 C07 C09 · checked 2026-10-18
95% of the 2020 US Dietary Guidelines Advisory Committee had at least one conflict of interest with the food or pharmaceutical industries.
Scale 20 members
D07 · United States · 2020 · Documented ties · C05 · checked 2026-10-18
Canada banned partially hydrogenated oils from 17 September 2018 and made its front-of-package "high in" symbol mandatory from 1 January 2026.
Scale National
D08 · Canada · 2018, 2026 · Regulation · R06 C15 · checked 2026-10-18
WHO advises against non-sugar sweeteners for weight control (conditional recommendation, 2023).
Scale Global
D09 · Global · 2023 · Guideline · C21 N31 · checked 2026-10-18
Health Canada states that commercial infant foods are not needed and can be high in added sugar.
Scale National
D10 · Canada · Current guidance · Federal guidance · N22 · checked 2026-10-18
Tropical Race 4, the fungus that kills Cavendish bananas, reached Colombia in 2019, Peru in 2021, Venezuela in 2023, and Ecuador, the largest exporter, in December 2025.
Scale National
D11 · Latin America · 2019 to 2025 · Official detections · V03 V05 · checked 2026-10-18
A US court blocked the Sysco and US Foods merger in 2015, finding them the only two national broadline distributors; Canada's Competition Bureau moved to block Nortera's purchase of Green Giant in 2026, and the deal was abandoned.
Scale Two mergers
D12 · United States, Canada · 2015, 2026 · Court and regulator records · F06 W15 · checked 2026-10-18
Walmart Canada imposed a 1.25% infrastructure fee and a 5% e-commerce fee on suppliers in 2020; Canada's voluntary Grocery Code took full effect on 1 January 2026.
Scale National
D13 · Canada · 2020 to 2026 · Federal records · G06 G07 · checked 2026-10-18
Concluded9
What the measured and documented record adds up to.
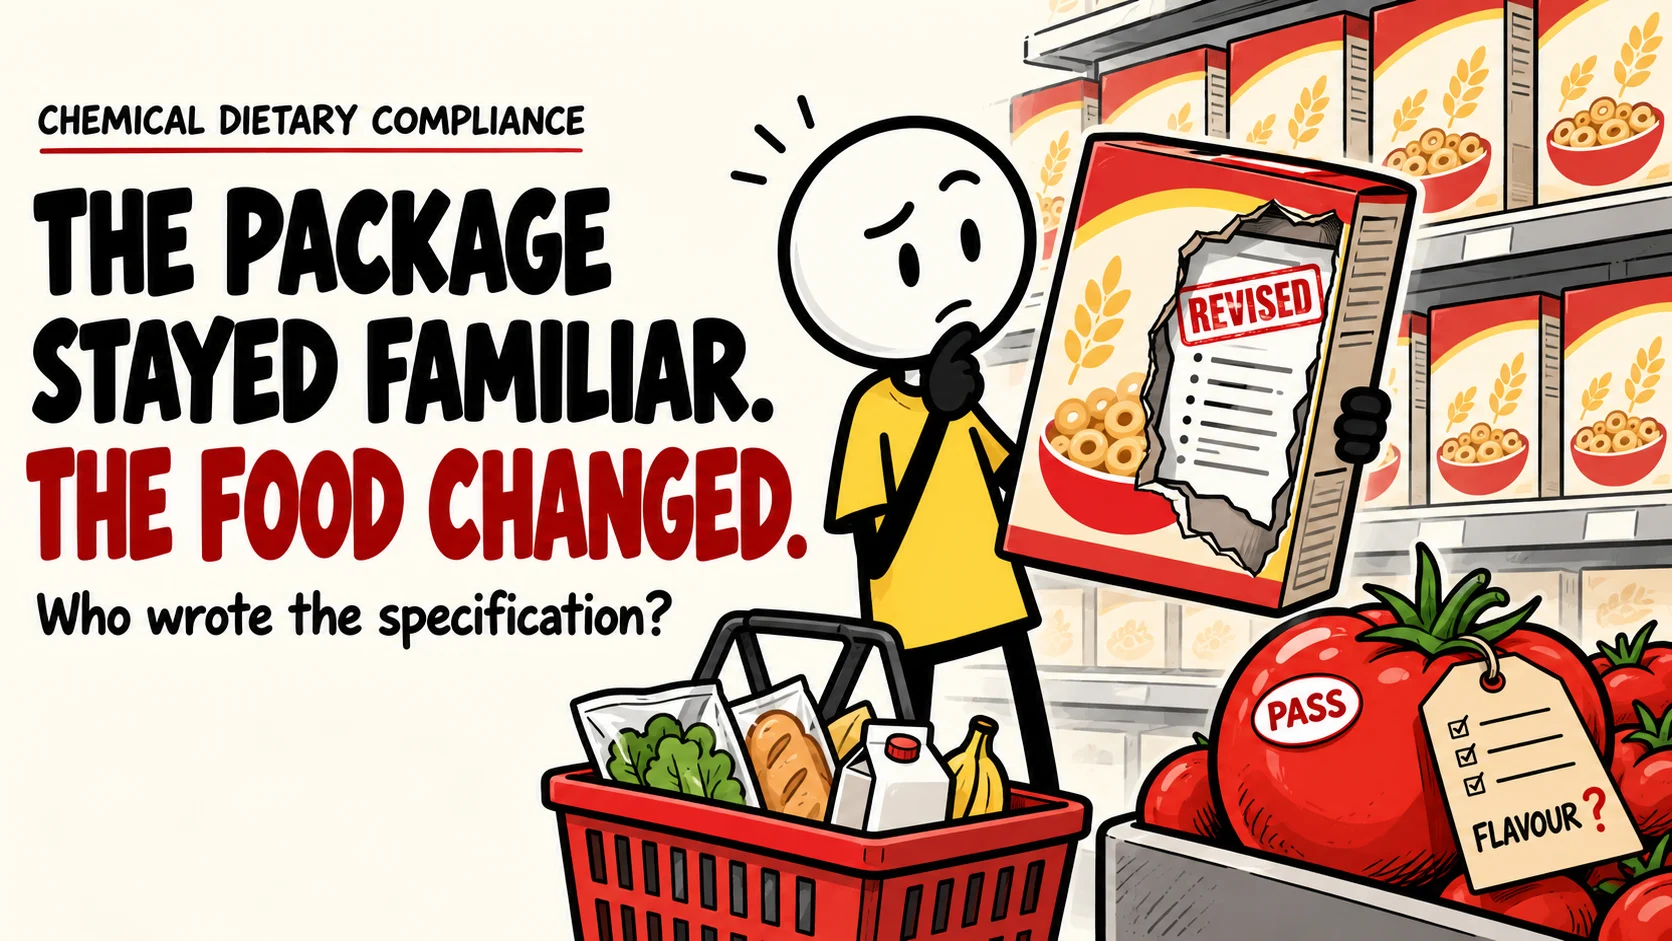
Familiar products are revised under unchanged names, and the cost-driven revisions are found by courts, consumer agencies and ingredient lists rather than announced.
Scale Named products and a national product supply
F1 · United States, Germany, New Zealand, Canada · 1980 to 2017 · Documented cases and matched products · R01 R04 R11 R14 R18 · checked 2026-10-18
Fresh produce is released on size, colour, shape, defects and firmness. Flavour is not a release criterion in Canada or in the general US grades, and the sugar floors that exist mark ripening potential, not eating quality.
Scale Every standard named
F2 · Canada and United States · Standards in force 2026 · Grade standards and marketing orders · S19 S21 S22 S01 S03 S04 S05 · checked 2026-10-18
Selection and storage for yield, appearance and durability have reduced flavour chemistry and nutrient concentration in the crops studied.
Scale Per variety and per gram
F3 · Tomatoes, apples, wheat, US garden crops · 1845 to 2024 · Chemical and nutrient measurement · P01 P02 P03 E04 E03 P16 · checked 2026-10-18
Ultra-processed diets raise energy intake by about 500 to 800 calories a day in controlled trials, through energy density and eating speed rather than greater enjoyment.
Scale Per person, per day
F4 · United States, Japan, Singapore, United Kingdom · 2019 to 2025 · Controlled feeding trials · H04 N36 N35 N33 E05 · checked 2026-10-18
Taste calibration follows exposure: preferred salt level tracks intake, vegetable liking is learned and often learned seasoned, and calibration begins with commercial infant foods that are frequently high in sugar.
Scale Individuals and national product sets
F5 · Canada, United States, Europe · 1982 to 2026 · Trials and product surveys · C24 C25 N28 L17 L08 L09 N18 N20 N22 · checked 2026-10-18
Healthier reformulation reached whole markets when a ban, levy or mandatory label required it; voluntary targets moved a minority of categories.
Scale National product supplies
F6 · Canada, United Kingdom, Chile · 2012 to 2020 · Before-and-after product shares · R06 R08 R20 R21 R09 R18 · checked 2026-10-18
The health costs of diet are carried outside the price of food, by the people who eat it and the public systems that treat them.
Scale Global and national, modelled
F7 · Global · 2024 to 2025 · Cost accounting and attributable-fraction modelling · H08 H02 H05 · checked 2026-10-18
The shelf is narrow at every layer: produce brings the shopper in and earns its margin, while supplier payments and the store's own labels fill the centre aisles, and seed, grocery retail and restaurant supply are each held by a few firms.
Scale Sectors
F8 · Canada, United States, global · 2003 to 2026 · Filings, benchmarks, market studies · G19 G01 G10 W05 W04 W18 F01 V02 · checked 2026-10-18
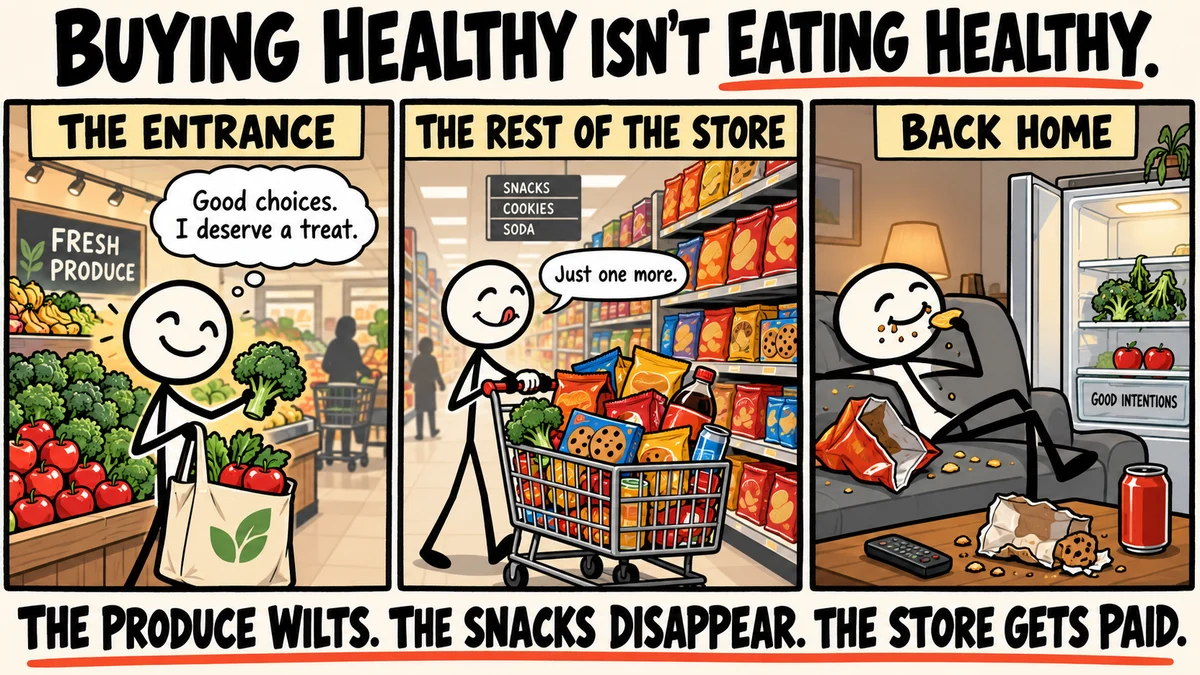
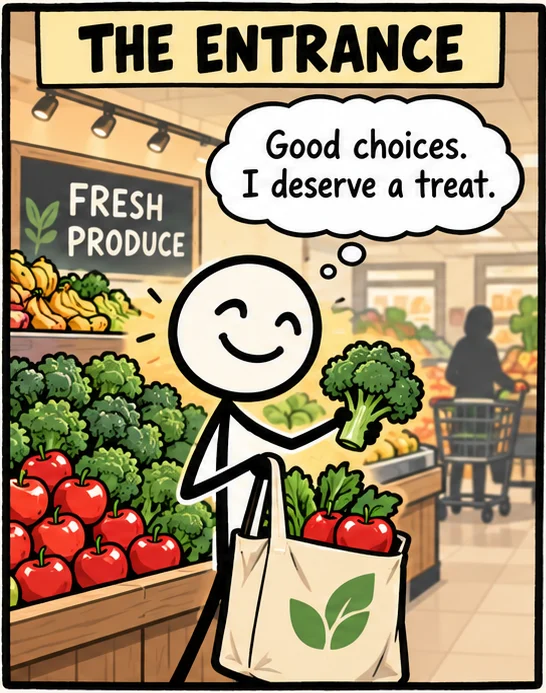
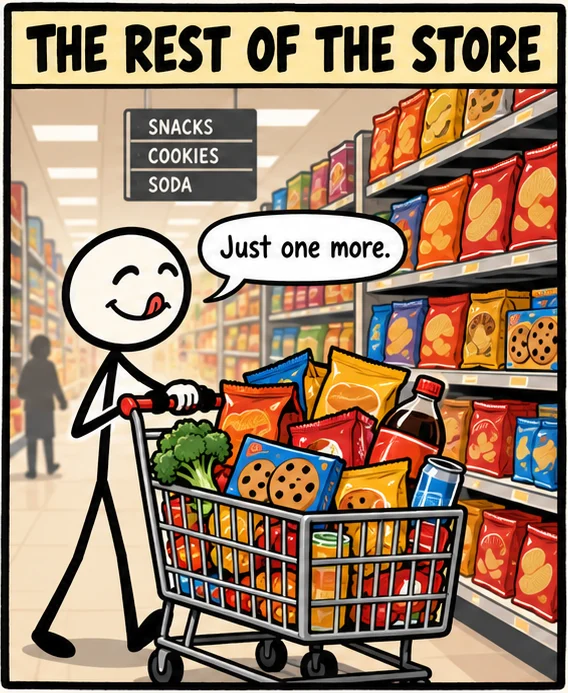
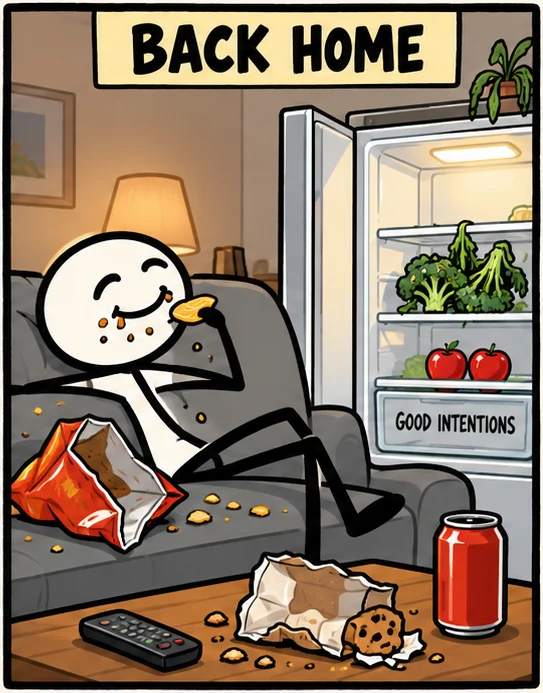
The healthy choice is bought more than it is eaten: produce is the store's main draw and the largest share of household food waste, while snacks are built to be finished. The healthy item does not reliably license the treat, and moving produce to the store entrance shifts baskets toward produce.
Scale Households and stores
F9 · Canada, United States, United Kingdom · 2009 to 2026 · Surveys, waste studies, trials, meta-analyses · Z01 Z10 Z16 Z21 Y12 Y15 · checked 2026-10-18

 The revisions, counted
 Firm is not fragrant



 The tobacco years

 Paying for the science