Chemical Dietary Compliance
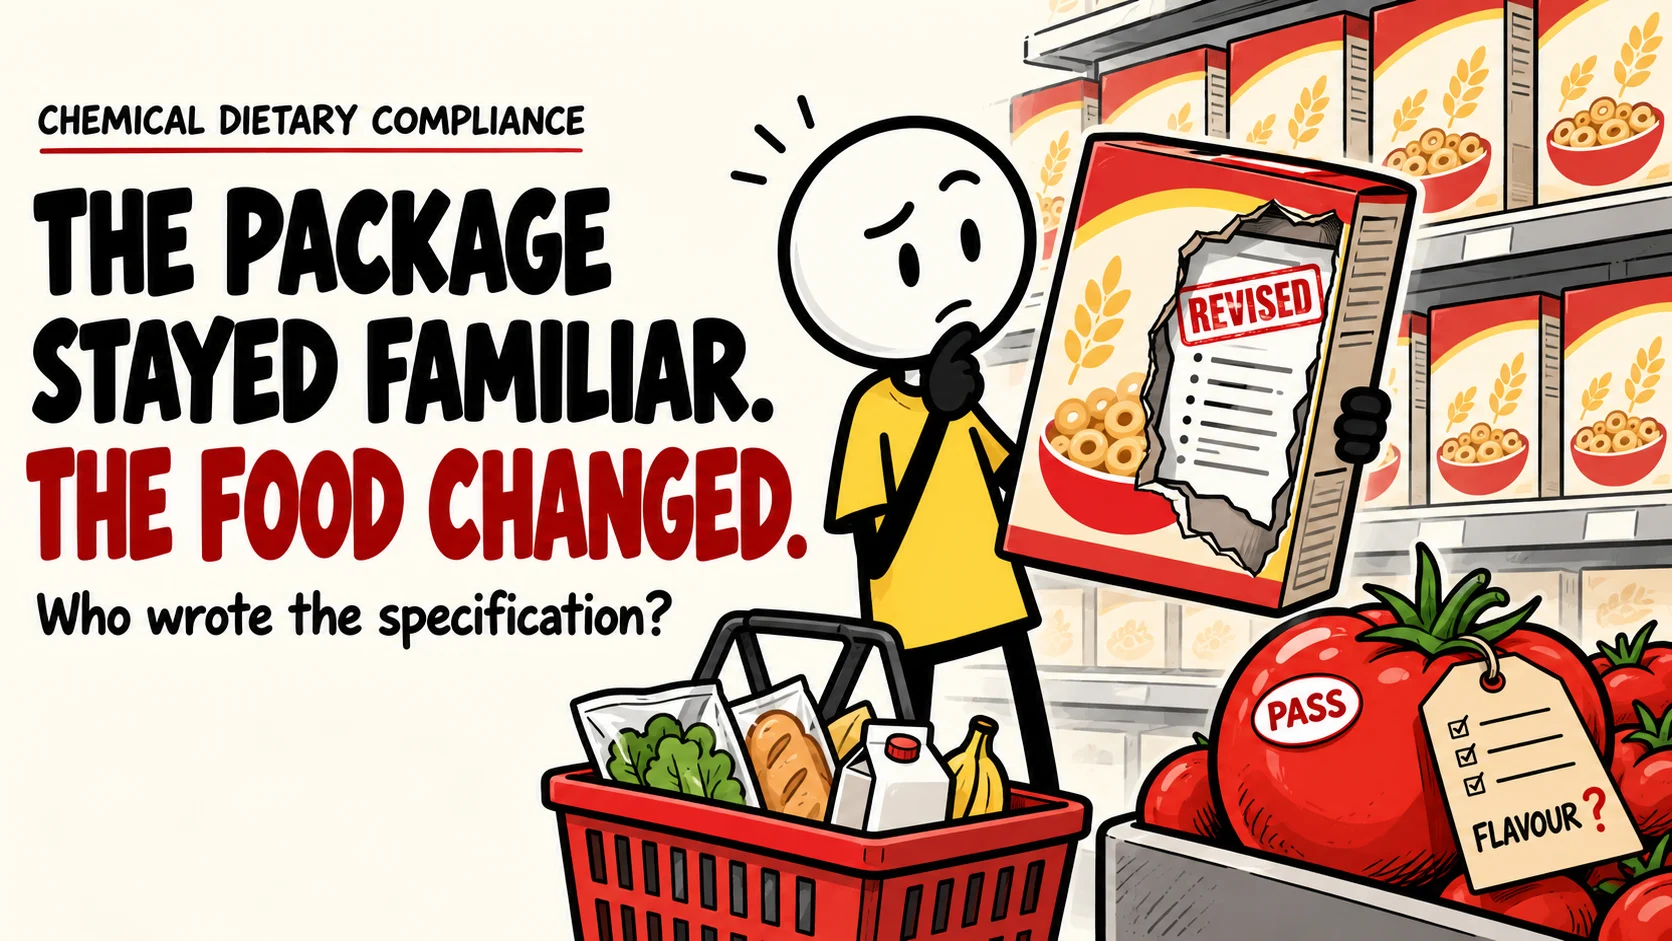
A stick figure in a yellow shirt stands in a supermarket aisle holding a familiar cereal box torn open to show a formula sheet stamped REVISED. A shopping basket sits in front, and a tomato stamped PASS carries a grading tag with three ticks and a red question mark beside flavour. Beside it: Chemical Dietary Compliance. The package stayed familiar. The food changed. Who wrote the specification?

A Feline Union file

The package stayed familiar. The food changed.

Every food on the shelf passed its inspection. This is a file on what the inspection checks, who wrote it, and what it never asks.

Hear the whole file All 10 parts, about 19 minutes. Four voices. Nothing plays until you press it.

Feline Union publishes free, source-linked files on how the systems around us are built, and who they are built for. This one connects to The Sweetening, The Sugar Loop and The Good Store Test. See where it leads.

Chemical Dietary Compliance

com·pli·ance, manufacturing
A product meets its specification.
com·pli·ance, medicine
A patient takes the dose as prescribed.

Ordinary food passes the first test every day. Its specifications are written for yield, transport, shelf life and margin. Nobody writes the prescription, and the dose is taken anyway. The product complies with its specification. The person eating it is brought into compliance with the product.

Name on the package
Unchanged
Formula
Revised
Released on
Size, colour, firmness
Flavour
Not a criterion
Dose
Unprescribed
Adverse events
Billed elsewhere
Change control

The name is kept. The formula is revised.

In a factory, change control is the paperwork that records every revision to a product. On the shelf there is none. The name, the logo and the price band carry over, and the revision is found later by a court, a consumer agency or someone reading the ingredient list.

The size is the revision people notice. Between 2021 and 2023, 29.6% of the grocery items Statistics Canada tracks for package size got smaller at least once, and 77.6% of the size cuts were on name brands C13. The formula is the revision they do not.

Revisions made for cost

From January 1980, Coca-Cola let its US bottlers replace half the sugar in its syrup with high-fructose corn syrup, a cheaper sweetener. By November 1984 the syrup contained no sugar at all. The dates are recorded in a 1993 federal appeals court opinion, not in an announcement R01. In Canada the label today reads "sugar/glucose-fructose", which allows either R03.

In 2017, Hamburg's consumer protection agency found that German Nutella had changed: skimmed milk powder up from 7.5% to 8.7%, sugar up from 55.9% to 56.3%, and the colour lighter. Its laboratory put the cocoa at about 7.4%, down from about 8.5%. Ferrero called it a fine adjustment R04.

In 2007 and 2008, Hershey replaced cocoa butter with vegetable oils in several US products, and Kissables went from "milk chocolate" to "chocolate candy" because they no longer met the legal standard for milk chocolate R11 R13. In New Zealand, Cadbury put palm oil into Dairy Milk and took it out again in 2009 after customers noticed R14.

EVIDENCE REV-1On the record

Four revisions under unchanged names, each found by someone other than the maker

Coca-Cola, United States: sugar replaced by high-fructose corn syrup, January 1980 to November 1984, dated in a 1993 appeals court opinion. Nutella, Germany: milk powder 7.5% to 8.7%, sugar 55.9% to 56.3%, cocoa about 8.5% to 7.4%, found by Hamburg's consumer agency in 2017. Hershey, United States: cocoa butter replaced by vegetable oils, 2007 to 2008. Cadbury Dairy Milk, New Zealand: palm oil added, then removed in 2009 after customers objected.

MeasureCourt records, laboratory analysis, ingredient lists, company statements
WhereUnited States, Germany, New Zealand
When1980 to 2017
ScaleNamed products, one revision each

The revisions, counted

A fixed definition makes the drift measurable. A food counts as hyper-palatable when it hits one of three nutrient combinations: a lot of fat with a lot of salt, a lot of fat with a lot of simple sugar, or a lot of carbohydrate with a lot of salt. Applied unchanged to the US government's food databases, it caught 49% of foods in 1988, 62% in 2001 and 69% in 2018. The same items, tracked across those years, became about four times more likely in odds terms to meet it, mostly through fat combined with salt E01.

Share of foods classified as hyper-palatable in the study's US food databases

Three measured years. The line joins them; it does not show the years in between.

0%25%50%75%100%49%198862%200169%2018
United States. Food items in national food composition databases, not purchases or shelf space. Source: Demeke et al. (2023). Change in hyper-palatable food availability in the US food system over 30 years: 1988-2018. Public Health Nutrition. doi:10.1017/S1368980022001227 · ledger E01

Canadian packaged food sits level with it. Applied to 5,340 Canadian packaged products in 2023, the same definition caught 61.37%, against 63.03% of American products K03.

Packaged products meeting the hyper-palatability definition, 2023

The same three nutrient combinations, applied to packaged foods on sale in each country.

Canada 5,340 products 61.37%United States 63.03%
Canada and United States. Packaged products listed in Open Food Facts. Source: Jun et al. (2025). Examination of hyper-palatable foods and their nutrient characteristics using globally crowdsourced data. PLoS ONE 20(6):e0325479; code and data OSF 9juwz. doi:10.1371/journal.pone.0325479 · ledger K03

Canada's own reference file does not record the revisions, because it rarely takes the measurement again. Of 3,442 foods listed in both the 2001 and the 2026 editions of Health Canada's nutrient file, 55% carry exactly the same energy, fat, carbohydrate and sodium values in both K11 K06.

Ultra-processed food, classified by how a food is made rather than by its nutrients, supplied 45.7% of Canadians' daily energy in 2015, and more than half for children and teenagers H09.

Which way the revisions run

Revisions run both ways under the same names. Across 6,628 Canadian products matched between 2013 and 2017, 12.4% cut their sugar and 11.0% raised it R18. Health Canada's voluntary sodium targets were met in 13 of 94 food categories, and 48% of categories made no meaningful progress R09.

The healthier revisions that reached whole markets came with a rule. Canada banned partially hydrogenated oils on 17 September 2018 R06. After the UK announced its soft drinks levy, the share of drinks above 5 grams of sugar per 100 millilitres fell from an expected 49% to 15% R20. Chile's warning labels cut the share of best-selling products rated "high in" a nutrient from 70.8% to 52.5% R21.

EVIDENCE REV-2Measured

Whole markets moved toward health when a rule required it

Canada's trans fat ban took effect on 17 September 2018; products declaring partially hydrogenated oils had already fallen from 5.7% to 2.6% as it approached. The UK soft drinks levy cut drinks above 5 g of sugar per 100 mL from an expected 49% to 15%. Chile's warning labels cut best-selling products rated "high in" from 70.8% to 52.5%. Canada's voluntary sodium targets were met in 13 of 94 categories, and matched Canadian products raised their sugar about as often as they cut it.

MeasureShare of products over a threshold, before and after
WhereCanada, United Kingdom, Chile
When2012 to 2020
ScaleNational product supplies

Left to the maker, a formula is revised toward cost. It is revised toward health when a rule requires it.

Release criteria

Released for the trip, not the meal

A batch is released when it meets its release criteria. Fresh produce has them too. They are written in the grade standards and the marketing orders, and they describe a fruit that will survive the truck.

Canada's grades, the general US grades and the US government's own purchase specification for fresh fruit release produce on size, colour, shape, defects, condition and a cap on over-ripeness. None of them tests flavour. The strawberry, tomato and peach standards carry no sugar test at all S19 S21 S22.

EVIDENCE G1On the record

Release criteria for fresh produce: size, colour, shape, defects, firmness

Canada's grade compendium, the general US grades and the US purchase specification for fresh fruit contain no flavour test. Sugar appears only as minimum-maturity floors for a few crops, set where fruit will finish ripening: kiwifruit at 6.2% soluble solids, lowered from 6.5% in 2000. Zespri, selling on eating quality, refuses kiwifruit below 15.5% dry matter.

MeasureCriteria written into grade standards, marketing orders and purchase specifications
WhereCanada and United States
WhenStandards in force, 2026
ScaleEvery grade standard and order named in the ledger

Where sugar is written in, it is a floor

Sugar becomes a condition of sale for a short list of crops, as a minimum-maturity floor. Kiwifruit must reach 6.2% soluble solids. Table grapes 14% to 17.5% depending on variety. California cantaloupe 8%. Honeydew 10%. Valencia oranges a sugar-to-acid ratio of 8 to 1 S01 S06 S14 S09.

Where sugar is a condition of sale

Minimum-maturity floors written into law. Every other fresh fruit and vegetable is released without one.

CropLegal floorWhere
Kiwifruit6.2% soluble solidsUS order and imports
Table grapes14% to 17.5%, or 20:1 sugar to acidCalifornia; US orders
Cantaloupe8% (California), 9% US No. 1California; USDA grade
Honeydew10%California
Valencia oranges8 to 1 sugar to acidCalifornia
Red Delicious apples11% before 1 October (10% until 2002)Washington
Tomatoes, strawberries, peachesNoneUS grades
Every Canadian gradeNoneCFIA compendium
Soluble solids are mostly sugars, measured as degrees Brix. Sources: S01 S06 S14 S09 S18 S22 S19

Those floors mark the point at which fruit will finish ripening and survive storage. In 2000 the US lowered the kiwifruit floor from 6.5% to 6.2%, citing ripening potential, other exporters' rules and lower reinspection costs, and declined to raise it S03. University of California researchers tie consumer acceptance of kiwifruit to at least 15.1% dry matter at harvest S04. Zespri, which sells on eating quality, refuses kiwifruit below 15.5% dry matter and pays its growers more as dry matter rises S05.

Washington State shows what happens when the floor is raised. In 2002 it lifted the minimum for Red Delicious shipped before 1 October from 10% to 11% soluble solids, in its own words "to market a sweeter more edible apple" S18.

The tomato, specified

Most Florida tomatoes are picked mature-green and ripened with ethylene gas for one to five days, and 20% or more of a green-picked lot can be too immature to ripen properly S24. The grower is paid on packout, grade, size and yield S29.

In 2017 a team led by Denise Tieman and Harry Klee measured flavour chemicals in 398 modern, heirloom and wild tomatoes. Thirteen flavour compounds were significantly lower in modern varieties. Forty-seven of 48 modern varieties carried the low-sugar version of two key sugar genes, and bigger fruit was reliably less sweet. The flavour genes were lost while breeders selected for yield, disease resistance and firmness P01.

EVIDENCE P01Measured

Modern tomatoes carry less of 13 flavour compounds than heirlooms

398 modern, heirloom and wild tomatoes profiled. Thirteen flavour-associated volatiles were significantly lower in modern varieties. 47 of 48 modern varieties carry the low-sugar version at two key sugar loci, and fruit weight correlated strongly and negatively with sugar.

MeasureFlavour chemicals and sugars, linked to consumer panel ratings
WhereGrown in Florida; second population in Israel
WhenPublished 2017
DesignChemical profiling and genome-wide association across 398 varieties
ScaleThe tomato varieties in commercial and heirloom use
Tieman et al. (2017). A chemical genetic roadmap to improved tomato flavor. Science 355(6323):391-394. doi:10.1126/science.aal1556 · ledger P01

For about 70 years breeders selected tomatoes that ripen to an even red, so a whole crate colours at once. The trait is a broken copy of a gene that builds chloroplasts in the fruit, and fruit with the working gene carry about 10% more of the sugars and acids that make taste P02.

Firm is not fragrant

Apples are sold most of the year from cold, low-oxygen storage, often after treatment with 1-MCP, a compound that blocks the ripening hormone ethylene and keeps fruit firm. In Michigan State University trials on seven varieties stored up to eleven months, 1-MCP and the lowest-oxygen storage each held back the return of aroma, storage length did the most damage, and the effects added up P03 P04.

Cavendish bananas are just under half of world production and nearly all of the export trade. They are cut green, shipped at about 13 to 14 degrees Celsius because colder fruit is damaged, and ripened in rooms dosed with ethylene, typically 100 parts per million for a day; naturally ripened bananas carry more aroma compounds P05 P06 P07 P08. Carrots stored near that gas make 6-methoxymellein, a bitter compound, and room-temperature retail storage cuts their beta-carotene and vitamin C by up to 70% P09 P11.

More per hectare, less per gram

Rothamsted's Broadbalk field in England has kept its wheat since 1845. Zinc, iron, copper and magnesium in the grain held steady until the mid-1960s and then fell as semi-dwarf high-yield varieties came in. The soil did not get poorer. Yield and the share of the plant that becomes grain explain the decline E04.

EVIDENCE E04Measured

Wheat minerals held steady for 120 years, then fell with high-yield varieties

In grain archived at Rothamsted since 1845, zinc, iron, copper and magnesium were stable until the mid-1960s, then declined as semi-dwarf high-yielding varieties arrived. Soil levels stayed stable or rose. Yield and harvest index explain the decline. Variety trials in other crops show the same negative link between yield and mineral concentration.

MeasureMineral concentration in archived grain
WhereBroadbalk experiment, England
WhenGrain archived from 1845
DesignAnalysis of archived grain and soil from one long-term field
ScaleConcentration per gram of grain

Across 43 US garden crops, the USDA's 1999 tables show lower median values than its 1950 tables for six nutrients, from 6% less protein to 38% less riboflavin E03. Variety trials show the same mechanism directly: higher-yielding varieties carry lower concentrations of minerals and protein, a genetic dilution effect P16.

Median decline in 43 garden crops, USDA tables 1950 vs 1999

Six nutrients showed reliable declines as a group. The two ends of that range are shown; the four in between are not published here.

Protein smallest decline −6%Riboflavin largest decline −38%
United States. Moisture-adjusted comparison of published tables; analytical methods changed between 1950 and 1999. Source: Davis et al. (2004). Changes in USDA food composition data for 43 garden crops, 1950 to 1999. Journal of the American College of Nutrition. doi:10.1080/07315724.2004.10719409 · ledger E03

Produce is released when it can survive the trip. Whether it is worth eating is not a release criterion.

Fruit and whole grains remain what diets are shortest of: diets low in whole grains and low in fruit are two of the three largest dietary costs in the FAO's accounting H08. The produce is still the better food. It is specified for someone other than the person eating it.

Adherence

Built to be taken in larger doses

Adherence is the clinical word for taking the full dose, on schedule. The controlled trials of ultra-processed food measure exactly that: how much people take when nobody tells them how much to take.

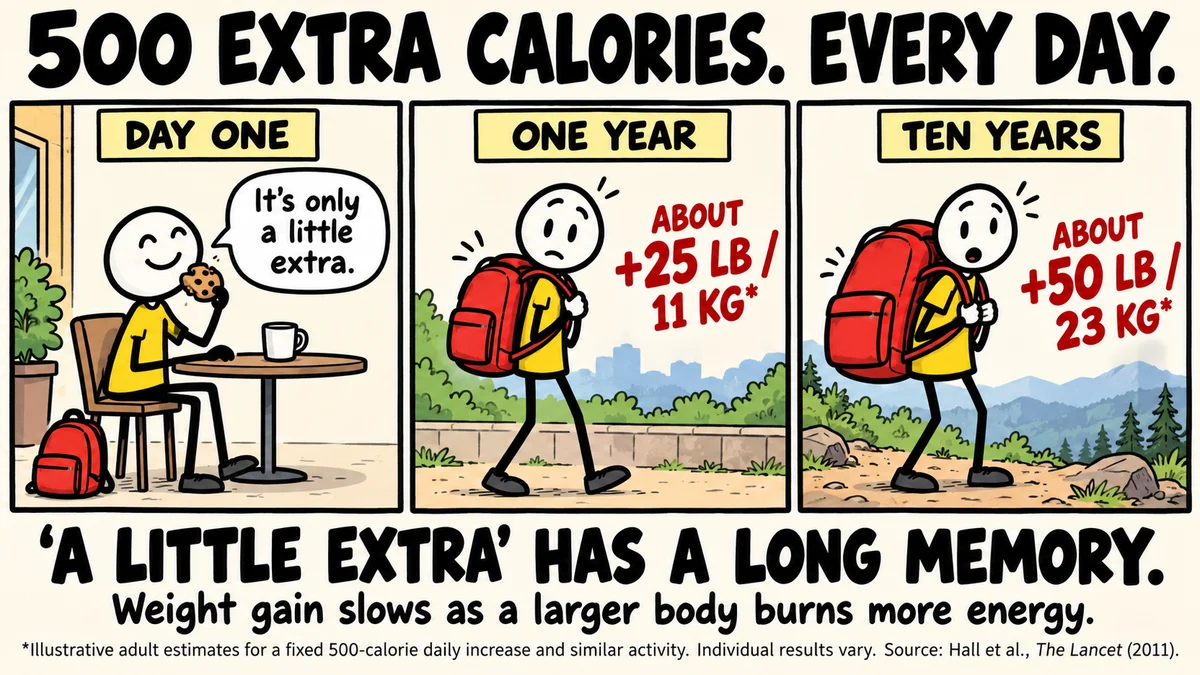
Three-panel cartoon headed 500 extra calories. Every day. Day one: a stick figure eats a cookie and says it is only a little extra, a small red backpack at its feet. One year: the figure walks with a bigger red backpack, labelled about plus 25 pounds, 11 kilograms. Ten years: a huge backpack, about plus 50 pounds, 23 kilograms. Below: a little extra has a long memory. Weight gain slows as a larger body burns more energy.
500 extra calories. Every day. Day one: a stick figure eats a cookie at a cafe table and says it is only a little extra. A small red backpack sits on the floor. One year: the figure walks carrying a bigger red backpack. About plus 25 pounds, 11 kilograms. Ten years: the figure strains under a huge red backpack on a mountain trail. About plus 50 pounds, 23 kilograms. A little extra has a long memory. Weight gain slows as a larger body burns more energy.

In 2019 the US National Institutes of Health admitted 20 adults for four weeks. Two weeks of ultra-processed meals, two weeks of minimally processed meals, in random order, eat as much as you like. The meals offered were matched for calories, energy density, macronutrients, sugar, sodium and fibre. On the ultra-processed diet people ate about 508 more calories a day and gained about 0.9 kilograms; on the other they lost about 0.9 H04.

EVIDENCE H04Measured

On ultra-processed meals, people ate 508 more calories a day

Twenty adults, two weeks on each diet, offered meals matched for calories, energy density, macronutrients, sugar, sodium and fibre. They gained about 0.9 kg on the ultra-processed diet and lost about 0.9 kg on the other. A 2024 repeat in Japan found 813.5 more calories a day.

MeasureEnergy intake and body weight
WhereNIH Clinical Center, United States; Japan
When2019 and 2024
DesignInpatient randomised crossover trials
ScalePer person, per day

Held every day, a dose that size compounds. In the NIH's model of adult metabolism, each 10 extra calories a day adds about a pound of eventual body weight, half of it within a year and 95% within about three. Five hundred extra calories a day comes to about 25 pounds, 11 kilograms, in the first year, and about 50 pounds, 23 kilograms, where it levels off, because a larger body burns more H13.

A 2024 trial in Japan repeated the design with nine men for a week on each diet. On the ultra-processed diet they ate 813.5 more calories a day, gained 1.1 kilograms more, and chewed less per calorie N36.

How the dose gets larger

In the NIH trial, people ate the ultra-processed meals faster and did not rate them as more pleasant. Across 2,733 measured meals, energy density, eating speed and hyper-palatable food each independently raised how much people ate N35. When meals were given a harder texture so they took longer to eat, people ate 26% fewer calories N33.

The extra intake does not come from enjoying the food more. It comes from food that is denser, softer and quicker to finish.

The tobacco years

US tobacco companies owned some of the largest American food companies from 1980 to 2001. Between 1988 and 2001, foods they owned were 29% more likely to meet the fat and salt definition and 80% more likely to meet the carbohydrate and salt definition than other foods. By 2018 those combinations were common across the food supply E02.

EVIDENCE E02Measured

Tobacco-owned food brands were more likely to be hyper-palatable

Between 1988 and 2001, foods owned by US tobacco companies were 29% more likely to meet the fat and sodium definition and 80% more likely to meet the carbohydrate and sodium definition. By 2018 these combinations were widespread regardless of ownership.

MeasureLikelihood of meeting hyper-palatability definitions, by owner
WhereUnited States
When1988 to 2001, and 2018
DesignOwnership coded from tobacco industry documents, matched to USDA food data; 105 tobacco-owned foods
ScaleUS food database items

Philip Morris bought General Foods in 1985 and Kraft in 1988. R.J. Reynolds bought Nabisco Brands in 1985 and had owned Hawaiian Punch since 1963. Kool-Aid, Tang and Capri Sun sat under Philip Morris until Kraft was spun off in 2007. A 1962 R.J. Reynolds document observed that "many flavourants for tobacco [would] be useful in food, beverage and other products" C02 C07.

On the Yale Food Addiction Scale, the foods most tied to loss of control are processed foods high in fat and fast-digesting carbohydrate: pizza, chocolate, chips H01. Pooled across studies using the scale, 14% of adults and 12% of children meet its threshold H12.

Calibration

The palate is set to the product

Instruments are calibrated against a reference. The palate is calibrated against what it is fed, and the controlled studies show how.

Intake sets the level

Adults who cut their sodium for five months came to prefer less salt in their food C24. Adults who cut simple sugars for three months rated the same puddings about 40% sweeter, while liking them no more and no less C25. Intensity follows intake. For sweetness, liking holds steady: a six-month trial that raised or lowered 180 adults' exposure to sweet foods left their liking for sweetness where it was N28.

Vegetables are learned

Repeated tasting raises children's liking for a vegetable L17. Flavour pairing works too: children who are sensitive to bitterness ate 80% more broccoli when it came with a dip, and toddlers ate more green beans with added salt L08 L09. What is learned is the vegetable as seasoned.

What the supply now carries

Statistics Canada's food availability series puts salad oils at 2.62 kilograms per person in 1970 and 17.22 kilograms in 2025, while refined sugar fell from 44.97 to 27.13 kilograms L25. The fat-and-salt combination that drove the US database trend is the direction the supply has moved.

What Canada's food supply carries per person, 1970 and 2025

Kilograms per person per year available for consumption. Two measured years each.

Salad oils 1970 2.62 kgSalad oils 2025 17.22 kgRefined sugar 1970 44.97 kgRefined sugar 2025 27.13 kg
Canada. Food available for consumption, not intake. Source: Statistics Canada (2026). Food available in Canada (Table 32-10-0054-01). Statistics Canada data table (release 28 May 2026). www150.statcan.gc.ca/t1/tbl1/en/tv.action?pid=3210005401 · ledger L25

The first calibration

Calibration starts early. In 2010, 53% of 186 Canadian baby and toddler foods drew more than 20% of their calories from sugar N18. In a 2025 national analysis, 55% of 423 infant and toddler products would carry Canada's "high in sugars" symbol N20. Health Canada's own guidance says commercial infant foods are not needed and can be high in added sugar N22.

Infants routinely given sugar water drank more sugar water at six months and at two years N25. The formulation is the manufacturer's decision. Infant formula itself is necessary for the babies who need it; the WHO and UNICEF finding concerns how it is marketed, which reached 51% of parents and pregnant women surveyed in eight countries C20.

The palate is set against the product on the shelf. The product is set against its specification.

Authorised by

Who signs the specification

Every specification carries a signature block. On ordinary food the signatures belong to breeders, growers, buyers, manufacturers and the people who write the rules, each paid to optimise something specific.

Who decides what reaches the shelf

  1. BreedersSelect for yield, disease resistance, uniform ripening and firmness, the traits growers are paid for.
  2. Growers and packersPaid on packout, grade, size and yield. "The grower is paid for size and yield, and flavor is irrelevant," in the words of the tomato geneticist Harry Klee.S29 S30
  3. Grades and buyer specificationsRelease fruit on size, colour, shape, defects and firmness.
  4. ManufacturersRevise formulas for cost, shelf life and repeat purchase.
  5. RetailersDecide what is stocked, where, and under whose label.
  6. Regulators and the science behind themSet the labels, the limits and the guidance.
  7. The eaterTakes the dose.

Why the signatures point one way

The Lancet's November 2025 series on ultra-processed food sets out that these foods grow because they are more profitable than other food, and that the main barrier to policy is the industry's coordinated political activity: lobbying, placing people inside government agencies, and litigation H05.

Paying for the science

In 1965 the Sugar Research Foundation paid two Harvard researchers $6,500 to review the evidence on diet and heart disease. Their review ran in the New England Journal of Medicine in 1967, singled out fat and cholesterol, played down sugar, and did not disclose the funding C03.

EVIDENCE C03On the record

The sugar industry paid for a heart disease review and did not disclose it

The Sugar Research Foundation approved Project 226 on 13 July 1965 and paid two Harvard researchers $6,500. Their 1967 review in the New England Journal of Medicine singled out fat and cholesterol and played down sucrose. The funding was not disclosed. A later industry-funded study that linked sucrose to raised blood fats was defunded in 1970 and never published.

MeasureInternal industry documents
WhereUnited States and United Kingdom
When1965 to 1970
DesignHistorical analysis of archived correspondence
ScaleTwo research projects

In 1968 the same industry funded a rodent study in Birmingham. When it produced early results linking sucrose to raised blood fats, the funder rated its value "nil" in September 1970, stopped paying, and the results were never published C04.

Of the 20 people who advised on the 2020 US Dietary Guidelines, 95% had at least one conflict of interest with the food or pharmaceutical industries, most often research funding and advisory board seats C05.

The signature that changes the direction

Health Canada's front-of-package "high in" symbol for saturated fat, sugars and sodium became mandatory on 1 January 2026, and Health Canada expected manufacturers to reformulate rather than carry it C15. The trans fat ban, the UK levy and Chile's labels show what that signature does: it moves a whole market toward health.

The direction of a formula follows whoever writes its specification.

Planogram

The store is drawn around the label

A planogram is the drawing that tells a store what goes on each shelf, where, and how much room it gets. It is a specification too, and the record shows what it is drawn to do.

Produce at the door

In the grocery industry's own research, produce is the number one reason shoppers choose a store G19. Single produce items are priced to pull people in. In Britain's 2009 banana war, Asda sold loose bananas at 47 pence a kilo while importers were asking £1.20, and Waitrose's managing director said matching it was costing well over £100,000 a week G14.

The department itself pays its way. Across 15 US chains in 2023, produce earned a 38% gross margin on 14.8% of store sales, after losing about 5.5% of it to spoilage, against roughly 28% for the average independent grocer's whole store G01 G17. In Canada, fresh fruit and vegetables are 12.6% of food retailers' sales, about the same as packaged dry goods G03.

The centre aisles carry other income

A supermarket stocks 33,248 items V20. The last federal count of produce items in American stores was 335 V21. The rest of the store earns money the produce aisle does not: payments from the manufacturers whose products fill it. Kroger booked $8.5 billion in vendor allowances in 2017, against $2.1 billion in operating profit; much of it funds price promotions, and all of it is money the supplier pays the store G10. In the FTC's 2003 case studies, slotting fees to launch one product nationally ran from about $1 million to more than $2 million G11.

In 2020 Walmart Canada imposed a 1.25% infrastructure fee and a 5% e-commerce fee on its suppliers, and Loblaw raised its own G06. Canada's voluntary Grocery Code took full effect on 1 January 2026 G07. The store also writes its own labels: about a third of Loblaw's grocery sales are its control brands, made by contract manufacturers, and George Weston Limited owns 52.6% of Loblaw W05.

EVIDENCE PLAN-1Measured

Produce brings shoppers in; the centre aisles bring supplier money

Produce is the top driver of store choice and carries a 38% gross margin in US chains. Bananas are a documented price-war item. The centre aisles add income produce does not: Kroger booked $8.5 billion in vendor allowances in 2017, four times its operating profit, and launching one product nationally cost $1 million to more than $2 million in slotting fees. Loblaw's own brands are about a third of its grocery sales.

MeasureDepartment margins, vendor allowances, slotting fees, private-label share
WhereUnited States, United Kingdom, Canada
When2003 to 2026
ScaleChains and national grocery sectors

Every layer held by a few

Five chains take most of Canada's grocery sales. A US government estimate for 2024 puts Loblaw at 17%, Costco at 15%, Sobeys at 14%, Walmart at 13% and Metro at 6% W04. The Competition Bureau found food gross margins up one to two points since 2017, while the three largest grocers' profits rose from $2.4 billion in 2019 to $3.6 billion in 2022 G04.

Upstream, four firms held about half of global commercial seed sales in 2020, and in the European Union four firms hold 72% to 95% of the plant variety rights for tomato, lettuce, cucumber and carrot W18 W17.

The layers are held by different owners. Dole's packaged foods were sold to ITOCHU in 2013, and Campbell bought Bolthouse Farms' carrots in 2012 and sold them in 2019 W11 W14. The exception is new: in March 2026 Fresh Del Monte bought the bankrupt packaged Del Monte business, putting the brand under one owner for the first time in nearly four decades W10. In Canada this year, the Competition Bureau moved to block Nortera, already the dominant vegetable processor and maker of grocers' private labels, from buying Green Giant, and the deal was abandoned W15.

The advertising follows the shelf. Fruit and vegetables received 2.1% of the food and drink advertising spend measured in Canada in 2019 W20. In the US, food advertising ran to $13.4 billion in 2017, about 3% of it for juice, water, nuts and fruit combined W19.

Fewer varieties on the shelf

Almost all bananas in international trade are a single clone, Cavendish, and yellow bananas are 90.8% of US banana sales V02 V23. Cavendish replaced Gros Michel after a soil fungus destroyed it in the middle of the last century. A new strain that kills Cavendish, Tropical Race 4, reached Colombia in 2019, Peru in 2021 and Venezuela in 2023, and in December 2025 Ecuador, the world's largest exporter, confirmed it and declared an emergency V03 V05.

Five varieties supply about 60% of the US apple crop: Gala, Red Delicious, Honeycrisp, Granny Smith and Fuji V07. New premium apples are licensed to closed clubs; Cosmic Crisp can be grown only in Washington until 2032 V10. The seed catalogue did not collapse the way an often-quoted figure claims: vegetable varieties offered for sale in 2004 were within about 2% of 1903 V15. The narrowing is in what is grown at scale and shipped. Between 1961 and 2009 national food supplies around the world became 36% more alike V19.

Five apples, about 60% of the US crop

Forecast 2025 US production, millions of 42-pound bushels.

Gala 47MRed Delicious 39MHoneycrisp 34MGranny Smith 32MFuji 25M
United States. Industry forecast. Source: US Apple Association (2026). USApple 2025 and 2026 Apple Industry Outlook (as reported). Fresh Fruit Portal (15 Aug 2025; 22 Sep 2026); The Packer. www.freshfruitportal.com/news/2025/08/15/usapple-outlook-report-2025/ · ledger V07

The restaurant kitchen

In 2025, 56.3% of US food spending went to food away from home F08; Canadian households spent about 28% of their food budget in restaurants in 2023 F10. That supply is concentrated too. Sysco estimates it serves about 18% of a $377 billion US foodservice market, and its own Sysco brand makes up 35.4% of the cases its US broadline business ships F01. When Sysco tried to merge with US Foods in 2015, a federal court found they were the only two national broadline distributors and blocked the deal F06.

Fresh produce is 8% of what Sysco sells; meat, canned and dry goods, and frozen food are 53% F01. In Canada, more than half the energy eaten in restaurants is ultra-processed F11.

The produce aisle invites the shopper in and earns its margin. The centre aisles carry the supplier payments and the store's own labels, and every layer behind them is held by a few.

Adverse events

Reported elsewhere, billed elsewhere

A drug's adverse events are reported to the regulator that approved it. Food's are reported to clinics, dentists and public budgets, and nothing routes them back to the specification.

At the scale of a person

In a British trial published in 2025, 55 adults ate two eight-week diets delivered to their homes. Both followed the UK's Eatwell Guide; one was ultra-processed, one minimally processed. They lost 2.06% of body weight on the minimally processed diet and 1.05% on the ultra-processed one, about a kilogram apart, with lower triglycerides and fewer food cravings on the minimally processed diet E05.

Body weight change after 8 weeks on each diet

Both diets followed the UK Eatwell Guide. Same people, both diets, in random order.

Minimally processed −2.06%Ultra-processed −1.05%
United Kingdom, 50 adults analysed. Difference 1.01 percentage points, 95% CI 0.14 to 1.87, P = 0.024. Source: Dicken et al. (2025). Ultraprocessed or minimally processed diets following healthy dietary guidelines on weight and cardiometabolic health: a randomized, crossover trial. Nature Medicine. doi:10.1038/s41591-025-03842-0 · ledger E05

Sugar's own adverse events are settled. In trials of free-living adults, cutting sugar lowered body weight by 0.80 kilograms and adding it raised weight by 0.75, through the extra calories N07. Tooth decay is lower when free sugars stay under 10% of energy, the basis of the WHO's 2015 recommendation N08 N06. Sugar-sweetened drinks raise C-reactive protein, a marker of inflammation: by 60% to 109% in three weeks in one trial, and across 64 trials sugar raised it when it came in sweetened drinks N01 N03.

Swapping the sugar for sweeteners does not close the file. The WHO advises against non-sugar sweeteners for weight control: long-term studies tie them to higher risks of obesity, type 2 diabetes and heart disease, while short trials show only small weight losses C21 N31.

At the scale of a population

A 2025 model combined cohort studies into one estimate: each 10-point rise in the ultra-processed share of a diet carries about 3% higher risk of dying early. Across eight countries, that attributes between 4% of premature deaths in Colombia and 14% in the United Kingdom and the United States to ultra-processed food H02.

In Canada, adults eating the most ultra-processed food had 31% higher odds of obesity, 37% higher odds of diabetes and 60% higher odds of hypertension than those eating the least H10.

EVIDENCE H02Measured

4% to 14% of premature deaths attributable to ultra-processed food in eight countries

Pooled cohort studies give about a 3% higher risk of premature death for each 10-point rise in the ultra-processed share of the diet. Applied to national diets, that attributes 4% of premature deaths in Colombia and 14% in the UK and US to ultra-processed food.

MeasurePopulation attributable fraction of premature deaths
WhereAustralia, Brazil, Canada, Chile, Colombia, Mexico, UK, US
WhenPublished 2025
DesignDose-response meta-analysis of cohort studies with comparative risk modelling
ScaleNational populations, modelled
Nilson et al. (2025). Premature Mortality Attributable to Ultraprocessed Food Consumption in 8 Countries. American Journal of Preventive Medicine 68(6):1091-1099. doi:10.1016/j.amepre.2025.02.018 · ledger H02

At the scale of the system

The UN Food and Agriculture Organization prices the hidden costs of the world's agrifood systems at 11.6 trillion dollars a year in 2020 purchasing-power terms. Seventy percent, 8.1 trillion, comes from diets that lead to chronic disease, led by diets low in whole grains, high in sodium and low in fruit H08.

Hidden costs of agrifood systems, 156 countries

11.6 trillion dollars a year, in 2020 purchasing-power-parity dollars. Most of it is health.

70% · 8.1 trillion 30% Dietary patterns leading to chronic disease Environmental, social, other Largest dietary risks in the health share: low whole grains 18% · high sodium 16% · low fruit 16%
Global modelled estimate. FAO attributes these costs to dietary risks, not to ultra-processed food as a category. Source: FAO (2024). The State of Food and Agriculture 2024 - Value-driven transformation of agrifood systems. FAO, Rome (ISBN 978-92-5-139140-2). doi:10.4060/cd2616en · ledger H08

Those costs are absent from the price at the till. They are paid by the people who eat the food and by the public systems that treat them, and none of it returns to the people who set the specification.

The revenue is booked at the register. The adverse events are booked to someone else.

1845 to 2026

Lot history

Revisions, payments, measurements and rules, dated. Filled markers are measurements; red markers are decisions.

  1. Broadbalk wheat begins to be archived

    Grain kept at Rothamsted from this year later shows mineral levels stable for 120 years.

    Measured · E04 Fan et al. 2008
  2. USDA nutrient tables used as the baseline for 43 garden crops

    Compared with the 1999 tables half a century later.

    Measured · E03 Davis et al. 2004
  3. R.J. Reynolds buys the maker of Hawaiian Punch

    It keeps the brand until 1989.

    On the record · C02 Nguyen et al. 2019
  4. Sugar Research Foundation approves Project 226

    A review of diet and heart disease, paid at $6,500.

    On the record · C03 Kearns et al. 2016
  5. Wheat mineral density starts to fall

    Coinciding with semi-dwarf, high-yield cultivars. Soil levels hold steady.

    Measured · E04 Fan et al. 2008
  6. The review appears in the New England Journal of Medicine

    It singles out fat and cholesterol. The sugar funding is not disclosed.

    On the record · C03 Kearns et al. 2016
  7. Sugar-funded rodent study rated 'nil' and defunded

    Its results linking sucrose to raised blood fats are never published.

    On the record · C04 Kearns et al. 2017
  8. Coca-Cola lets US bottlers use high-fructose corn syrup for half the sugar

    The cheaper sweetener, dated in a 1993 appeals court opinion.

    On the record · R01 US Court of Appeals for the Third Circuit 1993
  9. Coca-Cola's US syrup contains no sugarOn the record · R01 US Court of Appeals for the Third Circuit 1993
  10. Philip Morris buys General Foods; R.J. Reynolds buys Nabisco Brands

    General Foods brings Kool-Aid and Tang. Prices as reported at the time: $5.75 billion and $4.9 billion.

    On the record · C09 Christian Science Monitor 1985
  11. 49% of US database foods meet the hyper-palatability definitionMeasured · E01 Demeke et al. 2023
  12. Kraft accepts Philip Morris's offer

    Reported at $13.1 billion.

    On the record · C10 Wall Street Journal, via Funding Universe 1988
  13. US grade standard for fresh tomatoes takes effect

    Maturity, colour stage, shape, defects. No flavour criterion.

    On the record · P12 USDA AMS 1991
  14. USDA tables show six nutrients lower than in 1950

    Median declines from 6% (protein) to 38% (riboflavin).

    Measured · E03 Davis et al. 2004
  15. R.J. Reynolds tobacco separated from NabiscoOn the record · C08 RJ Reynolds Tobacco Holdings Inc. 1999
  16. US lowers the kiwifruit sugar floor from 6.5% to 6.2%

    Reasons given include lower reinspection costs.

    On the record · S03 USDA Agricultural Marketing Service 2000
  17. 62% of US database foods meet the definitionMeasured · E01 Demeke et al. 2023
  18. Kraft goes public; Philip Morris keeps about 84%On the record · C06 Kraft Foods Inc. 2002
  19. Washington raises its Red Delicious sugar floor to 11%

    "To market a sweeter more edible apple."

    On the record · S18 Washington State Department of Agriculture 2017
  20. Altria spins off Kraft

    The end of tobacco ownership of the brands studied.

    On the record · C07 Kraft Foods Inc. 2008
  21. Hershey's Kissables become "chocolate candy"

    Cocoa butter replaced with vegetable oils.

    On the record · R11 ConfectioneryNews 2008
  22. Cadbury New Zealand takes palm oil back out of Dairy MilkOn the record · R14 Food Processing 2009
  23. The uniform-ripening trait is traced to a broken gene

    About 70 years of selection for even colour.

    Measured · P02 Powell et al. 2012
  24. Ultra-processed food supplies 45.7% of Canadians' daily energyMeasured · H09 Polsky et al. 2020
  25. Thirteen flavour compounds found lower in modern tomatoesMeasured · P01 Tieman et al. 2017
  26. Hamburg consumer agency finds German Nutella revised

    More milk powder and sugar, less cocoa.

    On the record · R04 Verbraucherzentrale Hamburg 2017
  27. 69% of US database foods meet the definitionMeasured · E01 Demeke et al. 2023
  28. UK soft drinks levy takes effectOn the record · R20 Scarborough et al. 2020
  29. Canada's ban on partially hydrogenated oils takes effectOn the record · R06 Health Canada 2018
  30. NIH trial: about 508 more calories a day on ultra-processed mealsMeasured · H04 Hall et al. 2019
  31. Tropical Race 4, the fungus that kills Cavendish bananas, reaches Colombia

    Peru follows in 2021 and Venezuela in 2023.

    On the record · V03 Munhoz et al. 2024
  32. Health Canada publishes front-of-package labelling rulesOn the record · C15 Health Canada 2022
  33. WHO advises against non-sugar sweeteners for weight controlOn the record · C21 World Health Organization 2023
  34. FAO prices hidden agrifood costs at 11.6 trillion PPP dollarsMeasured · H08 FAO 2024
  35. Japanese trial: 813.5 more calories a day on ultra-processed mealsMeasured · N36 Hamano et al. 2024
  36. UK trial: two guideline diets, different weight lossMeasured · E05 Dicken et al. 2025
  37. The Lancet series names corporate political activity as the main barrier to policyOn the record · H05 Baker et al. 2025
  38. Ecuador, the largest banana exporter, confirms Tropical Race 4 and declares an emergencyOn the record · V05 FreshPlaza 2026
  39. Front-of-package 'high in' symbol mandatory in CanadaOn the record · C15 Health Canada 2022
  40. Fresh Del Monte buys the bankrupt packaged Del Monte business

    The brand is under one owner for the first time in nearly four decades.

    On the record · W10 Fresh Del Monte Produce Inc. 2026
Audit findings

What the file establishes

Eight findings, each resting on the record above.

  1. Formulas are revised under unchanged names. Cost-driven revisions are found by courts, consumer agencies and ingredient lists. They are not announced.
  2. Fresh produce is released on appearance and durability. No Canadian grade and no general US grade tests flavour. Where a sugar floor exists, it sits at the point fruit will finish ripening, below what eaters accept as good.
  3. Breeding and storage for the trip cost flavour and nutrient density. Modern tomatoes carry less of 13 flavour compounds. Wheat bred for yield carries less zinc, iron, copper and magnesium in every gram.
  4. Ultra-processed food raises the dose. In controlled trials people ate about 500 to 800 more calories a day, driven by energy density and eating speed.
  5. The palate follows the supply. Preferred salt level tracks salt intake, vegetables are learned, and the calibration begins with infant foods that Health Canada says are not needed.
  6. Formulas move toward health when a rule requires it. Bans, levies and mandatory labels moved whole markets. Voluntary sodium targets were met in 14% of categories.
  7. The costs are carried outside the price. 8.1 trillion dollars a year in health costs from diet worldwide, paid by eaters and public systems.
  8. The shelf is narrow at every layer. Produce brings the shopper in and earns its margin, while supplier payments and the store's own labels fill the centre aisles. Four firms hold half the world's commercial seed, five chains most of Canada's grocery, and one distributor about a fifth of US foodservice. Traded bananas are one clone, now under attack across Latin America.
MeasuredOn the recordConcluded

Measured30

Figures from a study, trial or official dataset, stated at the scale they were measured.

The share of US database foods meeting a fixed hyper-palatability definition rose from 49% in 1988 to 62% in 2001 and 69% in 2018.

Scale US food composition databases

M01 · United States · 1988 to 2018 · Share of database food items · E01 · checked 2026-10-18

61.37% of 5,340 Canadian packaged products met the hyper-palatability definition in 2023, against 63.03% of US products. In Health Canada's nutrient file, 55% of the 3,442 foods listed in both the 2001 and 2026 editions carry identical energy, fat, carbohydrate and sodium values.

Scale Packaged products; national reference file

M02 · Canada · 2001 to 2026 · Share of products; unchanged database values · K03 K11 K06 · checked 2026-10-18

Ultra-processed food supplied 45.7% of Canadians' daily energy in 2015, and more than half for children and adolescents.

Scale National dietary survey

M03 · Canada · 2004 and 2015 · Share of daily energy, NOVA · H09 · checked 2026-10-18

29.6% of eligible grocery items tracked in Canada's Consumer Price Index shrank between 2021 and 2023; 77.6% of the size cuts were on name brands.

Scale Eligible packaged groceries

M04 · Canada · 2021 to 2023 · Share of CPI grocery items · C13 · checked 2026-10-18

Of 6,628 Canadian packaged products matched between 2013 and 2017, 12.4% lowered their sugar and 11.0% raised it.

Scale National packaged supply

M05 · Canada · 2013 to 2017 · Matched product sugar content · R18 · checked 2026-10-18

Canada's voluntary sodium targets were met in 13 of 94 food categories; 48% made no meaningful progress.

Scale Processed food categories

M06 · Canada · 2012 to 2017 · Category averages vs targets · R09 · checked 2026-10-18

After the UK soft drinks levy was announced, drinks above 5 g of sugar per 100 mL fell from an expected 49% to 15%.

Scale UK soft drinks

M07 · United Kingdom · 2016 to 2019 · Share of drinks over threshold · R20 · checked 2026-10-18

Modern tomato varieties carry significantly less of 13 flavour compounds than heirlooms, and 47 of 48 carry low-sugar alleles at two key loci.

Scale 398 varieties

M08 · Varieties grown in Florida · Published 2017 · Flavour chemistry and genetics · P01 · checked 2026-10-18

Tomatoes with the working copy of the gene broken by uniform-ripening selection carry about 10% more soluble solids.

Scale Paired varieties

M09 · US research · Published 2012 · Soluble solids · P02 · checked 2026-10-18

In seven apple varieties stored up to eleven months, 1-MCP and very-low-oxygen storage each suppressed the recovery of aroma, and storage length had the largest effect.

Scale Commercial storage trials

M10 · Michigan · 2024 · Aroma volatiles · P03 P04 · checked 2026-10-18

In Broadbalk wheat, zinc, iron, copper and magnesium were stable from 1845 to the mid-1960s and then declined with semi-dwarf high-yield varieties, while soil levels held or rose.

Scale One long-term field

M11 · England · 1845 onward · Grain mineral concentration · E04 · checked 2026-10-18

Across 43 US garden crops, median values for six nutrients were lower in 1999 USDA tables than in 1950 tables, from 6% for protein to 38% for riboflavin.

Scale USDA composition tables

M12 · United States · 1950 vs 1999 · Median nutrient ratio · E03 · checked 2026-10-18

Offered meals matched for calories, energy density, macronutrients, sugar, sodium and fibre, adults ate about 508 more calories a day on an ultra-processed diet; a Japanese repeat found 813.5.

Scale Inpatient trials

M13 · United States, Japan · 2019, 2024 · Energy intake · H04 N36 · checked 2026-10-18

On two diets that both met the UK Eatwell Guide, adults lost 2.06% of body weight on the minimally processed diet and 1.05% on the ultra-processed diet over eight weeks.

Scale 55 adults, crossover

M14 · United Kingdom · Published 2025 · Weight change · E05 · checked 2026-10-18

Five months of lower sodium lowered adults' preferred salt level; three months of lower sugar made the same puddings taste about 40% sweeter with no change in liking.

Scale Controlled diet studies

M15 · United States · 1982, 2016 · Taste preference and intensity · C24 C25 · checked 2026-10-18

55% of 423 Canadian infant and toddler products would carry the "high in sugars" symbol.

Scale National product set

M16 · Canada · 2020 product data, published 2025 · Front-of-package criteria · N20 · checked 2026-10-18

Canada's salad oil supply rose from 2.62 kg to 17.22 kg per person between 1970 and 2025, while refined sugar fell from 44.97 kg to 27.13 kg.

Scale National supply

M17 · Canada · 1970 to 2025 · Food availability · L25 · checked 2026-10-18

Sugar-sweetened drinks raised C-reactive protein by 60% to 109% in three weeks; across 64 trials, sugar raised it when delivered in sweetened drinks.

Scale Controlled trials

M18 · Switzerland; international trials · 2011, 2022 · Inflammatory marker · N01 N03 · checked 2026-10-18

Cutting sugar lowered adults' body weight by 0.80 kg and adding it raised weight by 0.75 kg in trials of free-living people.

Scale Meta-analysis of trials

M19 · International · Published 2013 · Body weight · N07 · checked 2026-10-18

Each 10-point rise in the ultra-processed share of diet carries about 3% higher risk of premature death, attributing 4% to 14% of premature deaths across eight countries.

Scale National populations, modelled

M20 · Eight countries including Canada · Published 2025 · Attributable fraction · H02 · checked 2026-10-18

FAO prices the hidden costs of agrifood systems at 11.6 trillion 2020 PPP dollars a year, 70% of it from dietary patterns leading to chronic disease.

Scale Global, modelled

M21 · 156 countries · 2024 report · Hidden costs · H08 · checked 2026-10-18

Canadian adults eating the most ultra-processed food had 31% higher odds of obesity, 37% of diabetes and 60% of hypertension than those eating the least.

Scale National survey

M22 · Canada · Published 2021 · Odds ratios · H10 · checked 2026-10-18

No dietary or supplement intervention has been shown to treat long COVID across four trials of 794 patients; a healthy overall lifestyle before infection was linked to about half the risk of developing it.

Scale Patients and a nurses' cohort

M23 · International trials; United States cohort · 2023 to 2024 · Trials and cohort · N14 C17 · checked 2026-10-18

Each 10 extra calories a day adds about a pound of eventual adult body weight, half within a year and 95% within about three years; 500 extra calories a day comes to about 25 lb (11 kg) in the first year and about 50 lb (23 kg) at the plateau.

Scale Population-average adult

M24 · United States, adult model · Published 2011 · Modelled weight change · H13 · checked 2026-10-18

Produce carried a 38% gross margin on 14.8% of store sales across 15 US chains in 2023, against about 28% for independent grocers' whole stores.

Scale Chains

M25 · United States · 2023 to 2026 · Department gross margin · G01 G17 · checked 2026-10-18

Kroger booked $8.5 billion in vendor allowances in 2017 against $2.1 billion in operating profit.

Scale One retailer

M26 · United States · 2017 · Vendor allowances · G10 · checked 2026-10-18

Fruit and vegetables received 2.1% of measured food and drink advertising spending in Canada in 2019.

Scale National

M27 · Canada · 2019 · Advertising expenditure · W20 · checked 2026-10-18

Five varieties supply about 60% of the US apple crop, and yellow Cavendish bananas are 90.8% of US banana sales.

Scale National

M28 · United States · 2025 · Production and sales shares · V07 V23 · checked 2026-10-18

Sysco serves about 18% of a $377 billion US foodservice market; its own brand is 35.4% of its US broadline cases, and fresh produce is 8% of its sales.

Scale One distributor

M29 · United States · 2026 · Company filing · F01 · checked 2026-10-18

Four firms hold 72% to 95% of EU plant variety rights for tomato, lettuce, cucumber and carrot, and about half of global commercial seed sales.

Scale Sector

M30 · EU; global · 2018 to 2022 · Variety rights and seed sales · W17 W18 · checked 2026-10-18

On the record13

Decisions, payments, ownership and rules, with their dates.

Coca-Cola replaced sugar with high-fructose corn syrup in its US bottling syrup from January 1980, reaching no sugar by November 1984.

Scale One product

D01 · United States · 1980 to 1984 · Court record · R01 R02 · checked 2026-10-18

German Nutella's recipe changed in 2017: milk powder up, sugar up, cocoa down by laboratory measure.

Scale One product

D02 · Germany · 2017 · Consumer agency analysis · R04 R05 · checked 2026-10-18

The US kiwifruit maturity floor was lowered from 6.5% to 6.2% soluble solids in 2000, partly to reduce reinspection costs.

Scale One crop

D03 · United States · 2000 · Federal rule · S03 · checked 2026-10-18

Washington raised its Red Delicious soluble solids minimum from 10% to 11% in 2002 "to market a sweeter more edible apple".

Scale One crop

D04 · Washington State · 2002 · State rule · S18 · checked 2026-10-18

The Sugar Research Foundation funded a 1967 NEJM review of diet and heart disease without disclosure, and defunded a 1970 study linking sucrose to raised blood fats.

Scale Two projects

D05 · United States, United Kingdom · 1965 to 1970 · Internal documents · C03 C04 · checked 2026-10-18

Philip Morris and R.J. Reynolds owned General Foods, Kraft, Nabisco, Kool-Aid, Tang, Capri Sun and Hawaiian Punch between 1963 and 2007.

Scale Company ownership

D06 · United States · 1963 to 2007 · Ownership records and filings · C02 C07 C09 · checked 2026-10-18

95% of the 2020 US Dietary Guidelines Advisory Committee had at least one conflict of interest with the food or pharmaceutical industries.

Scale 20 members

D07 · United States · 2020 · Documented ties · C05 · checked 2026-10-18

Canada banned partially hydrogenated oils from 17 September 2018 and made its front-of-package "high in" symbol mandatory from 1 January 2026.

Scale National

D08 · Canada · 2018, 2026 · Regulation · R06 C15 · checked 2026-10-18

WHO advises against non-sugar sweeteners for weight control (conditional recommendation, 2023).

Scale Global

D09 · Global · 2023 · Guideline · C21 N31 · checked 2026-10-18

Health Canada states that commercial infant foods are not needed and can be high in added sugar.

Scale National

D10 · Canada · Current guidance · Federal guidance · N22 · checked 2026-10-18

Tropical Race 4, the fungus that kills Cavendish bananas, reached Colombia in 2019, Peru in 2021, Venezuela in 2023, and Ecuador, the largest exporter, in December 2025.

Scale National

D11 · Latin America · 2019 to 2025 · Official detections · V03 V05 · checked 2026-10-18

A US court blocked the Sysco and US Foods merger in 2015, finding them the only two national broadline distributors; Canada's Competition Bureau moved to block Nortera's purchase of Green Giant in 2026, and the deal was abandoned.

Scale Two mergers

D12 · United States, Canada · 2015, 2026 · Court and regulator records · F06 W15 · checked 2026-10-18

Walmart Canada imposed a 1.25% infrastructure fee and a 5% e-commerce fee on suppliers in 2020; Canada's voluntary Grocery Code took full effect on 1 January 2026.

Scale National

D13 · Canada · 2020 to 2026 · Federal records · G06 G07 · checked 2026-10-18

Concluded8

What the measured and documented record adds up to.

Familiar products are revised under unchanged names, and the cost-driven revisions are found by courts, consumer agencies and ingredient lists rather than announced.

Scale Named products and a national product supply

F1 · United States, Germany, New Zealand, Canada · 1980 to 2017 · Documented cases and matched products · R01 R04 R11 R14 R18 · checked 2026-10-18

Fresh produce is released on size, colour, shape, defects and firmness. Flavour is not a release criterion in Canada or in the general US grades, and the sugar floors that exist mark ripening potential, not eating quality.

Scale Every standard named

F2 · Canada and United States · Standards in force 2026 · Grade standards and marketing orders · S19 S21 S22 S01 S03 S04 S05 · checked 2026-10-18

Selection and storage for yield, appearance and durability have reduced flavour chemistry and nutrient concentration in the crops studied.

Scale Per variety and per gram

F3 · Tomatoes, apples, wheat, US garden crops · 1845 to 2024 · Chemical and nutrient measurement · P01 P02 P03 E04 E03 P16 · checked 2026-10-18

Ultra-processed diets raise energy intake by about 500 to 800 calories a day in controlled trials, through energy density and eating speed rather than greater enjoyment.

Scale Per person, per day

F4 · United States, Japan, Singapore, United Kingdom · 2019 to 2025 · Controlled feeding trials · H04 N36 N35 N33 E05 · checked 2026-10-18

Taste calibration follows exposure: preferred salt level tracks intake, vegetable liking is learned and often learned seasoned, and calibration begins with commercial infant foods that are frequently high in sugar.

Scale Individuals and national product sets

F5 · Canada, United States, Europe · 1982 to 2026 · Trials and product surveys · C24 C25 N28 L17 L08 L09 N18 N20 N22 · checked 2026-10-18

Healthier reformulation reached whole markets when a ban, levy or mandatory label required it; voluntary targets moved a minority of categories.

Scale National product supplies

F6 · Canada, United Kingdom, Chile · 2012 to 2020 · Before-and-after product shares · R06 R08 R20 R21 R09 R18 · checked 2026-10-18

The health costs of diet are carried outside the price of food, by the people who eat it and the public systems that treat them.

Scale Global and national, modelled

F7 · Global · 2024 to 2025 · Cost accounting and attributable-fraction modelling · H08 H02 H05 · checked 2026-10-18

The shelf is narrow at every layer: produce brings the shopper in and earns its margin, while supplier payments and the store's own labels fill the centre aisles, and seed, grocery retail and restaurant supply are each held by a few firms.

Scale Sectors

F8 · Canada, United States, global · 2003 to 2026 · Filings, benchmarks, market studies · G19 G01 G10 W05 W04 W18 F01 V02 · checked 2026-10-18

Share the file
BlueskyXFacebookLinkedInRedditEmail